

- Entry date 16.03.2026 Condition Monitoring – Special Offer for Wind Turbines GfM’s Peakanalyzer condition monitoring system has proven itself over many years in the monitoring...
-
Entry date 10.12.2025
Monitoring service for third-party systems using continuous online spectral analysis

-
Entry date 24.07.2025
Condition monitoring at HUSUM WIND 2025
-
Entry date 16.07.2025
Condition monitoring saves system operators a lot of money
-
Entry date 27.01.2025
Drum coupling monitoring - Automatic condition monitoring on cranes

-
WindEnergy Hamburg 2026
22.09.2026 - 25.09.2026
-
Maintenance München
08.10.2026
-
34th Wind Energy Days in Linstow
10.11.2026 - 12.11.2026
Aging
Aging is a reduction in the value of use under temporal influences. In particular, aging plays an important role for thermally stressed plants. For mechanical components, aging plays a subordinate role with proper use. However, lubricant is subject to aging.Amplitude
see Spectral analysisAmplitude Modulation
In addition to the superposition, the amplitude modulation, the multiplicative linking of signals, plays an essential role. In the simplest case, a high-frequency carrier signal  by the frequency
  , the amplitude
  and the phase
  by a low-frequency modulation signal
  with the parameters
  ,
,  and
and  multiplicatively. From the telecommunications industry, a formulation is known, which is also very close to real machine diagnostic signals. It corresponds to the above equation if the modulator is superimposed on an equal proportion:

In the frequency analysis of a modulated signal by means of a Fast Fourier Transformation, the modulating signal is imaged as sidebands of the carrier signal at the locations  and
and  . In addition, a spectral line is formed with the frequency of the carrier signal, the magnitude of which affects the amplitude of the carrier.
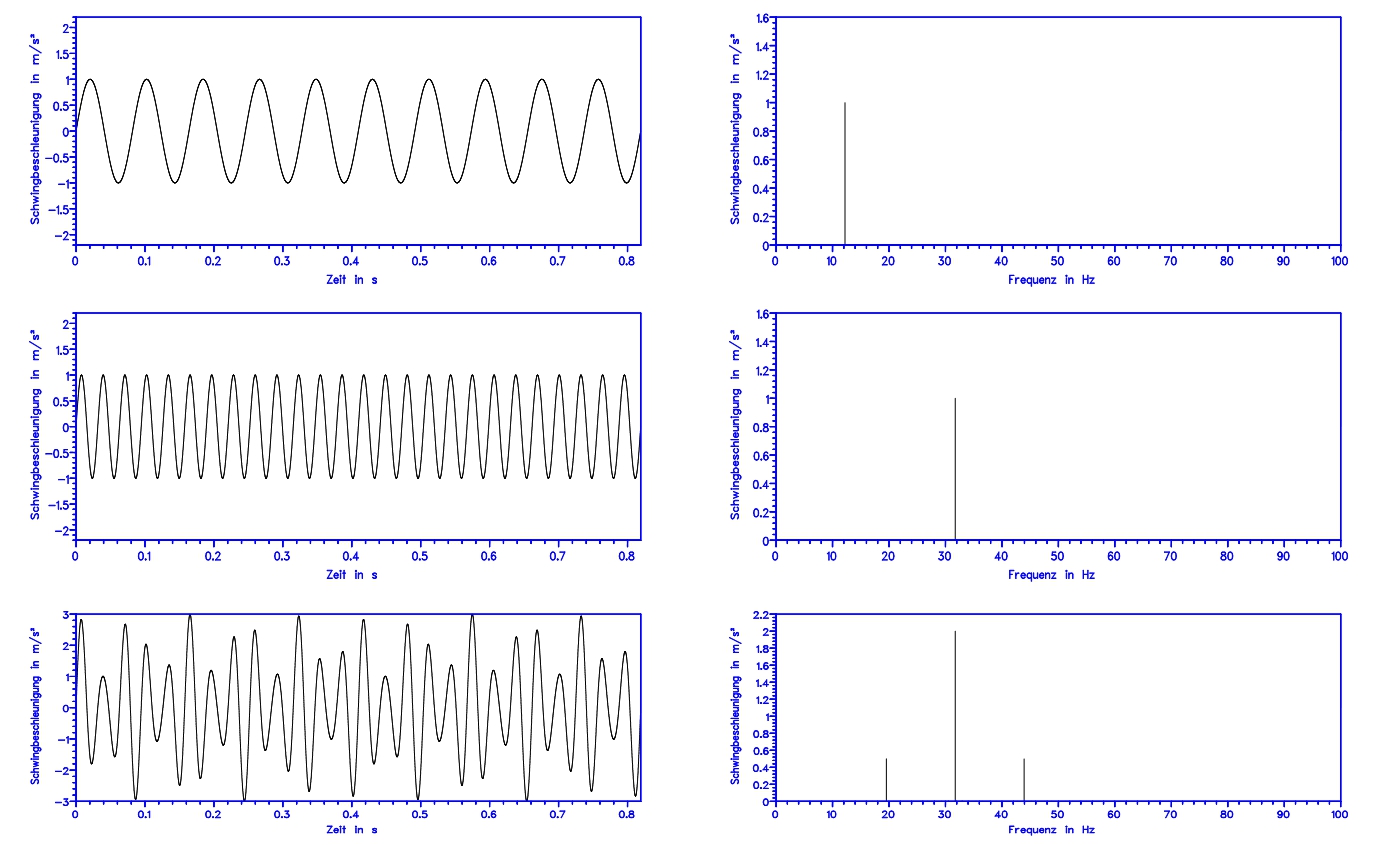
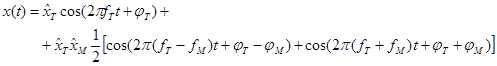
The picture shows the result of the multiplicative linking of two sinus signals. The representation corresponds to the function
 .
.
That is, the same sine functions are used which have already been used to describe the superposition.
Corrosion
Corrosion is a change in the material on the surface and in the inner material structure caused by electrochemical or chemical reactions in a certain environment.- Pitting and contact corrosion are mainly caused by a prolonged machine shutdown.
- Stress cracking corrosion occurs when tensile stresses act simultaneously
Discontinuities in the metal surface are the starting points. - Vibration cracking corrosion occurs on alternating stressed components.
- Friction corrosion is the result of small relative movements of two bodies that are in contact with each other.
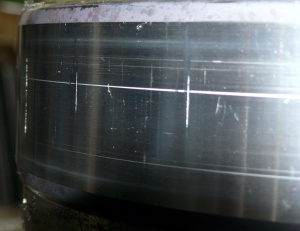
Standstill marks are the result of corrosion in combination with wear.
DIN ISO 10816-3
The rms value of the vibration velocity is used as the nominal value for the machine state. As with the predecessor, the VDI guideline 2056, the DIN ISO 10816-3 is usuable for drivcetrains. It divides the machines into different groups, which classify the machines.
In addition, the foundations are considered and divided into two groups: rigid and soft. The allocation results from the ratio of the elasticities of machine and foundation. If the lowest intrinsic frequency of the machine and subassembly overall system is at least 25% above the critical excitation frequency (in most cases, the rotational frequency), the foundation may be considered rigid in this direction. All other substructures can be called elastic.
Zones are defined for the evaluation. Here are:
| Zone A: | The vibrations of newly installed machines are usually in this zone.. |
| Zone B: | Machines whose vibrations are in this zone are usually considered suitable to operate without restrictions in continuous operation. |
| Zone C: | Machines whose vibrations are in this zone are usually not considered to be running continuously in continuous operation. In general, however, the machine may be operated in this condition for a limited time if there is a favorable opportunity for remedial action. |
| Zone D: | Vibrations within this zone are usually considered to be so dangerous as to cause damage to the machine. |
The DIN also specifies rules for alarm limits.
At the condition monitoring of machines using the rms value of the vibration speed, it should be noted that this value is relatively insensitive to low-energy excitations and thus a series of errors, for example errors in rolling bearings, can only be detected very unreliably.
DVS Analysis
It is a very old task, which has excellent solutions, in the meantime: To invent a machine, that decreases people`s work and considers complex correlations as well as man does.
A diagnostician, a human beeing, looks at a spectrum and detects abnormalities quickly. How he actually makes it, can not exactly be described. Of course, personal experience and intuition have a great impact.
In the DVS-analysis, the many lines at the spectrum are considered as one statistical mass. It is assumed, that a small part of lines does not obey the rules. So, they are outliers. These outliers are searched, by calculating a significance treshold for each spectrum. This significance treshold represents the allowable amplitude. A small part, the outliers, does not fit the scheme. In relation to the significance treshold, they are too large. That´s how the calculation works.
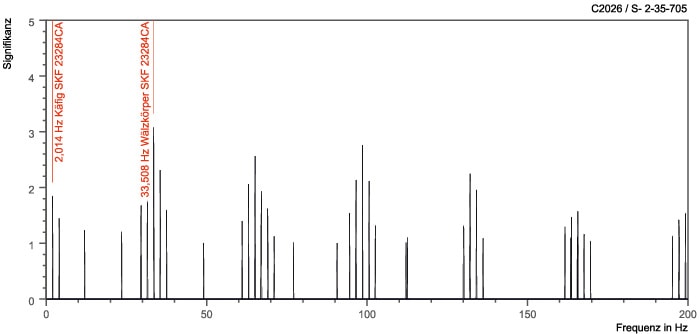
In the next step, all lines, except the outliers, are discarded. Now, the outliers are checked to compare them with a possible damage patterns.
Envelope Curve Analysis
The envelope curve analysis is a tool with which pulse impulses can be extracted. The folded signal is directly measurable on the surface of the machine - apart from signal distortions caused by sound transport. If a spectral analysis is carried out, however, one only finds the natural frequencies of the system. In order to make the original event, namely the impact sequence, clearly visible, the process of the convolution performed during the signal generation must be suitably inverted in order to separate the excitation function from the natural frequencies. The envelope curve analysis is suitable for this.
The formation of the envelope can be effected in various ways. The analogue or digital rectification is just as suitable as the envelope extraction by means of Hilbert transformation. One has to imagine that the positive peaks of the signal are connected together, as if a cover is placed over the whole. Sometimes a subsequent data compaction is advisable, but not mandatory. Disturbance signal components can be eliminated, for example, with a suitable high-pass filter before the envelope curve formation.
The envelope curve can then be subjected to spectral analysis using FFT. This creates the envelope spectrum. In the envelope spectrum, the impulse repetition frequency at 100 Hz as well as the harmonics (higher frequencies) are clearly shown. The sidebands which can be seen in the image result from the fact that the impact pulse sequence was amplitude-modulated.
The high-pass filtered envelope analysis is thus a tool for distinguishing harmonic excitations of impact excitations.
Fatigue
Fatigue is the separation of microscopic and macroscopic particles from the surface layer of a body.
- Hertzian stress results in a stress maxima below the surface.
- There are cracks under the surface.
- The crack continues.
- The rest fracture occurs when two force-bound surfaces are rolled.
FFT
see Spectral analysisFourier Transformation
see Spectral analysisGearbox Kinematics
In the case of spur gearing, the tooth meshing frequency results from the product of the rotational frequency with the number of teeth. This applies to straight or helical-tooth spur gears, bevel gearboxes as well as worm gearboxes.
In the case of planetary gearboxes, the central pinion is described as the sun, and the wheels with the orbiting axons as planets. The planets are located on the planet carrier, the bridge. A wheel is often internally toothed (ring gear) and used as a housing.
The formulas are given here as examples for the frequently occurring single-stage planetary gear with fixed ring gear.
When the rotational frequency of the sun is given, the rotational frequency of the bar is calculated:

And the spin frequency of the planetary gear:
(Indices: 1 - sun, 2 - planetary gear, 3 - ring gear, 4 - bar)
The tooth meshing frequency is calculated according to
In addition, frequencies are generated for the overrun of an irregularity on the sun bevel
 (K denotes the number of planetary gears),
For overrunning an irregularity on the ring gear and
For overrunning an irregularity on the planetary gear
 .
.Due to the production, there is a ghost frequency (also machine frequency) for gear wheels:
 .
.With
 - Number of teeth of the reference wheel.
Inspection
Inspection means all activities for the determination and assessment of the actual state of the technical means of a system. This mainly involves visual inspection, measurement of wear and the search for defects. In the given context, the terms inspection and machine diagnosis are synonyms.Maintenance
Maintenance is defined in DIN 31051 and consists of the service, inspection, repair and improvement of the technical instruments of a system.Service
Service is understood to be the activities for delaying the removal of the existing wear stock.
Inspection
Inspection means all avtivities for the determination and assessment of the actual state of the technical means of a system. This mainly involves visual inspection, measurement of wear and the search for defects. In the given context, the terms inspection and machine diagnosis are synonyms.
Repair
Repair means all activities for restoring the target state of technical instruments of a system.
Improvement
Improvement is understood to be the combination of all technical and administrative activities as well as activities taken by the management to increase the functional safety of an observation unit without changing its function.
Maintenance Strategies
In order to keep the costs and benefits of maintenance in a reasonable ratio, the question of the right maintenance strategy arises. This consideration becomes clear when one considers that, in addition to the costs of inspection and repair, costs are incurred as a result of the non-availability of production facilities (production losses).In practice, there are three basic maintenance strategies, which represent the possibilities of cost control, the operational, preventive and condition-based maintenance.
Missalignment
Faulty alignment between machine shafts is compensated to some extent by the coupling depending on the design. However, if the misalignment exceeds the compensating capacity of the coupling, additional loads are created for the involved machine elements. These are:
- increased static and dynamic bearing forces,
- increased shaft bending and torsional moments and
- axial forces.
This results, in addition to elevated temperatures on the bearings and coupling elements, in particular vibrations due to the wave deformation and the compensating movements in the clutch. These oscillations have a harmonic character and are connected to the rotational frequency of the non-directional waves and multiples of this frequency.
For the description of the alignment state, a distinction is made between:
- axial displacement
- angular displacement and
- radially offset.
The permissible deviations are specified by the clutch manufacturer. However, the significant shifts of the shafts to be aligned during operation must be considered.
Displacement can be detected by vibration diagnosis and corrected by align.
In the vibration signal, alignment errors are detected by sinusoidal oscillations with the rotation frequency and their harmonics.
In the spectrum, a spectral line at the rotational frequency and the second harmonic can be seen in the case of elastic coupling.
In the case of a rigid clutch, however, the rotational frequency and the first harmonic are often found.
Order Analysis
Damaging events at drives normally arise by periodical vibrations, which have a relation to the speed of the drive. The vibration collection as well as the vibration diagnosis are mostly time-dependent.
The method of the signal transformation for the compilation into the frequency range is used for a better evaluation of the vibration signals. In the simplest case, the frequency spectrum is created. The spectrum shows the amplitude as a function of the frequency. The unit of the abscissa is Hertz.
At drives with a constant speed the spectra can be created directly from the measuring data. This does not work for drives with variable speed. At first, the measuring data has to undergo an order analysis.
During the order analysis a signal is standardised to the speed with chronological synchronism so that a speed synchronized signal arises. Further analysis occurs in the usual way. The unit of the abscissa is the order.
One of the accepted and easy-to-apply methods is the resampling. Only after data collection the calculative resampling of the vibration signal occurs. Therefore, it is necessary to know the exact speed at every moment of the data collection. That means that for the above mentioned channels, the time channel and the vibration channel, an additional, third channel has to be recorded. This channel contains the momentary value of the speed at every sampling moment. Then, a speed synchronous signal is generated from the time signal.
Every device of GfM executes the order analysis by resampling.
Peak Amplitude
see Spectral analysisPreventive maintenance
After a fixed or flexible period (including periodic maintenance), the preventive maintenance provides the possibility of carrying out repairs in principle at times at which no plant operation has to be carried out.
The costs for this are often considerable, since the wear stock of components is generally not consumed. However, preventative maintenance is essential in the sense of safety in some applications.
Spectral Analysis
If we record any events, we usually do so in the order of their occurrence, or in another relatively arbitrary order.

If we take a plate of fruits, we can call the fruits in the order in which they lie on the plate. However, this is quite bulky for a larger quantity. That is why we make certain classes, in our example the classes "apple", "lemon", "cherry" and "banana". Now we are counting on how many representatives of each class are present, and we are implementing this in a corresponding system, for example a graphic.
This graphic is called spectrum.
With signals we do exactly the same. We first record a signal as a time signal. We then try to find unique structures in the signal and to represent their frequency in a spectrum. The simplest structures in an arbitrary signal are sine and cosine oscillations. We are therefore looking for sine and cosine oscillations with different frequencies and in this way try to reconstruct the signal as a sum of such oscillations.
For this purpose, mathematics offers the Fourier transformation or a fast and memory-optimized algorithm, the FFT (Fast Fourier Transformation).
A simple sinusoidal oscillation, which is integer in the time window, is represented as a line in the amplitude spectrum. The height of the line corresponds to the amplitude, ie the maximum elongation, of the time signal.
The peak amplitude is depicted here, in contrast to the RMS amplitude, which is actually more frequently used in Europe, which represents the RMS value. In the US, the peak-to-peak amplitude is also used. (RMS - root mean square)
For diagnostic signals which are not necessarily stationary in the time window, each individual spectral line of the magnitude spectrum is a measure of
- the frequency and
- with which amplitudes
the corresponding frequency component is contained in the time signal.
Spectrum
see Spectral analysisStrain Gauge
Strain gauges were invented in 1938 in Massachusetts, USA, by Arthur Claude Ruge. They are based on a simple physical principle. Each electrical conductor has an electrical resistance. This is dependent on material, temperature and the geometrical dimensions of the conductor. We are interested in the dimensions, as material and temperature are virtually constant during a measurement:
- As the length of the conductor increases, the electrical resistance increases too.
- As the cross sectional area of the conductor increases, also the electrical resistance decreases.
As a result, when an electrical conductor is stretched, its length is increased, and its cross-section is simultaneously reduced, the resistance increases. And while as long as this takes place in the elastic range, it also works the other way round. When the electrical conductor is compressed, its length is thus shortened and its cross-section is increased, its electrical resistance is reduced. This effect is used for DMS.
Arthur Claude Ruge stuck a thin wire of resistance in a meandering shape on a piece of thin silk paper. He held it on a curve. He compared the change in resistance with the actual load. The comparison showed that there was a good match between the results of its strain gauges and those of a conventional strain gage.
Today there is a very thin conductor on a carrier foil. As carrier film is, for example, polyimide used. The conductor is mostly made of constantan. This has a high temperature stability.
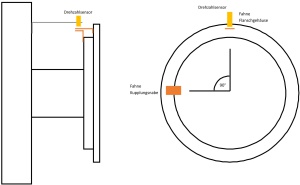
For measurement of torc strain gauges are applied in the main stress direction at an accessible shaft section. Four strain gauges are usually arranged in a plane perpendicular to the axis of rotation, offset by 90 degrees and rotated 45 degrees to the shaft axis. Thus, two strain gauges are exactly opposite each other. To simplify installation, two strain gauges are combined into one pair. Special strain gages pairs can be ordered.
Time Signal
see Spectral analysisTorque Analysis
Torsional vibration is the periodic change in torque as a function of time. Torsional oscillations often occur in connection with resonance phenomena, namely when the torsional vibration of a shaft or a drive train is excited. In addition, technologically induced oscillating forces can be determined qualitatively and quantitatively.
For the torsional vibration analysis of a drive, the high-frequency recorded torque is used. This is recorded by means of strain gages. First a strain gauge measuring point must be applied. The torque is now recorded high-frequency. If the speed is also stored, the power can then be calculated.
The torque signal during the deceleration process is shown in the time signal. A torsional vibration of the system is excited and the system vibrates accordingly. That is, the entire drive train is twisted and relaxed again. This process is repeated every 0.07 s, which corresponds to a frequency of 13.5 Hz.
A section is taken from the time signal and subjected to a Fourier transformation. The spectrum shows a main oscillation component at 13.5 Hz. This corresponds exactly to the oscillation seen in the time signal.
The Campbell diagram shows areas in which the diagonally extending excitation frequencies intersect with horizontal natural frequencies. Partially harmful resonance phenomena occur, in particular, in the case of a combination of excitation vibrations of high intensity with undamped natural oscillations. The concrete interpretation depends, of course, on the problem situation.
Torque Measurement
The knowledge of the torque profile of a working machine as a function of time or speed is the decisive basis for the safe and at the same time economical dimensioning of a drive. In order to get more information about the actual transmitted torque of a drive, the motor electricity is often measured and the power is calculated by means of voltage and efficiency. Taking into account the rotational speed, the torque is then quickly determined. However, high-dynamic processes do not flow into the motor current, so short torque peaks and vibrations are often not found in the motor electricity signal at all.To determine the exact torque profile of a drive, the torque on the output shaft or at least on the drive shaft of the transmission must be measured. There are basically two ways to achieve this. One either installs a torque measuring shaft or torque measuring disk, which usually requires small structural changes to the drive. Or a strain gauge is installed on an accessible piece of shaft. The second variant is usually the only option for an already installed, operating drive. It requires minimal intervention in the operation and does not entail any permanent changes to the drive.
The application of a torque measuring point takes some time and should be carried out by a corresponding specialist.
Data acquisition is defined by the measurement task. If the measuring point has been installed, all possible working situations can be recorded.
Accordingly, the analysis of the measurement data is then carried out as a timeline or as a classification matrix for statistical purposes.
The picture shows the torque curve during an unscheduled shutdown of a drive. This representation makes it clear that the torque had a strong dynamic component shortly before the switch-off.
For the analysis of exclusively dynamic components in torque, the torsional vibration analysis is used.
Wear
Wear is the process of advancing material loss from the surface layer of a solid body due to frictional contact with another solid, liquid or gaseous body or fabric. A distinction is made between sliding wear and rolling wear.
Sliding wear
- The surface is plastically deformed.
- Metallic patterns are formed in the sliding direction.
- In addition, abrasive wear takes place with mineral particles serving as a tool.
- Friction heat acts to promote wear by instantaneous welding and subsequent plastic separation.
- Die Ausbildung von plastisch verformten Arealen an Zahnflanken von Zahnrädern führt zu Auslösern für Ermüdungsschäden.
Roll wear (on rolling bearings)
- The oil film is broken.
- The strong mechanical contact leads to severe deformation and sliding wear. The sliding process is caused by the fact that the rolling elements are elastically deformed under heavy load and thus relative movements occur between the contacting surfaces.