- Entry date 16.03.2026 Condition Monitoring – Special Offer for Wind Turbines GfM’s Peakanalyzer condition monitoring system has proven itself over many years in the monitoring...
-
Entry date 10.12.2025
Monitoring service for third-party systems using continuous online spectral analysis

-
Entry date 24.07.2025
Condition monitoring at HUSUM WIND 2025
-
Entry date 16.07.2025
Condition monitoring saves system operators a lot of money
-
Entry date 27.01.2025
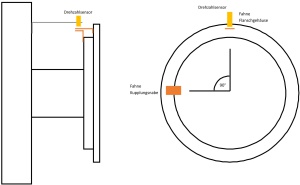
Drum coupling monitoring - Automatic condition monitoring on cranes

-
WindEnergy Hamburg 2026
22.09.2026 - 25.09.2026
-
Maintenance München
08.10.2026
-
34th Wind Energy Days in Linstow
10.11.2026 - 12.11.2026
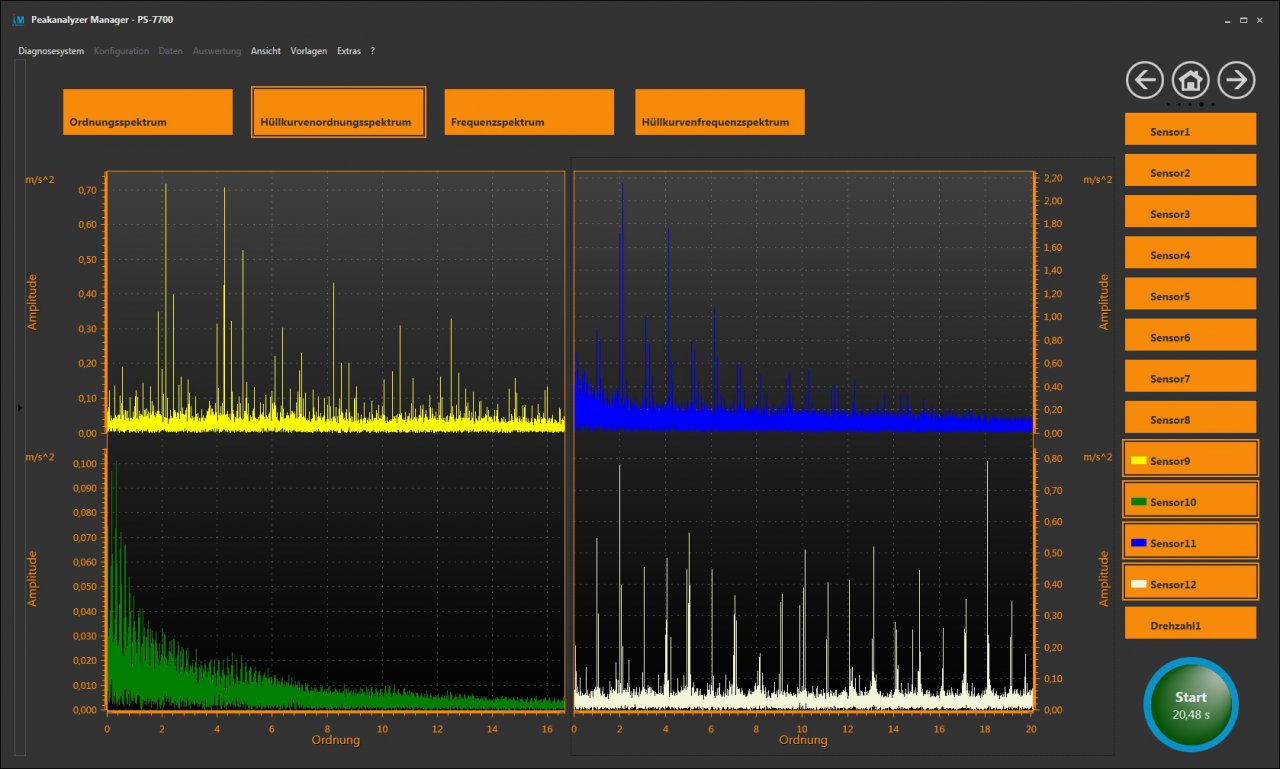
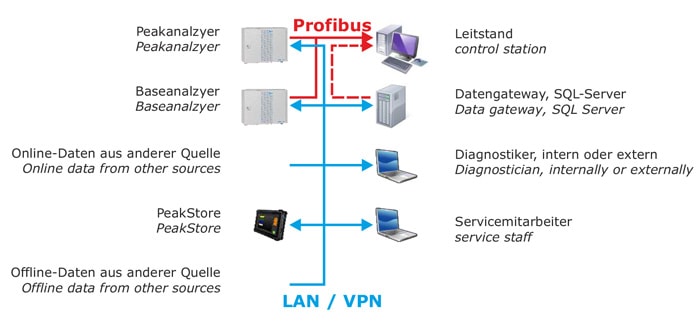
Peakanalyzer Manager
The Peakanalyzer Manager is an universal software supports different tasks:
- configure the online systems Peakanalyzer and Baseanalyzer
- configure the offline system PeakStore5xx
- monitoring service and alarm management for Peakanalyzer and Baseanalyzer
- fully automated frequency selective online monitoring of data from other sources
- fully automated offline diagnosis of PeakStore data
- fully automated offline diagnosis of data from other sources
- manual analysis of data.
The Peakanalyzer Manager stores data in an SQL database, that has to be located on the same computer or in the network. In the network, the SQL database can then be used by multiple users simultaneously.
In the Peakanalyzer the deep diagnostic monitoring is done in the Peakanalyzer itself. Of the measured time signals using the speed information spectra, order spectra and envelope curve order spectra are composed. These spectra will be analyzed regarding significant spectral components, which in turn are checked for compliance with kinematic damage patterns.
The same process takes place if data from other sources are used, although with the difference, that the analysis will be performed on the computer, on which the Peakanalyzer Manager is installed. So there has to exist an interface to the time data and the time data have to be supplied regularly to the Peakanalyzer Manager.
And then spectra, order spectra and envelope curve order spectra are composed, which are analyzed regarding significant spectral components, which in turn will be checked for compliance with kinematic damage patterns.
The same scenario is applied to data from offline meaurements. The diagnostic work is done in the Peakanalyzer again. In addition, the Peakanalyzer Manager has a report generator, which supports the generation of status and diagnostic reports.
Analysis Tools
The Peakanalyzer Manager also includes a number of convenient analysis tools:
- Diagrams of time signals, frequency spectra and order spectra
- Waterfall diagrams and spectrograms of all spectra
- Measurement cursor, harmonic cursor, sideband cursor and marker cursor
- Presentation of characteristics as a time plot
- Presentation of parameters as a time plot
Moreover, the comparison of spectra and trends between different machines is possible. A report generator simplifies reporting. Standard processes are executed automatically with it.
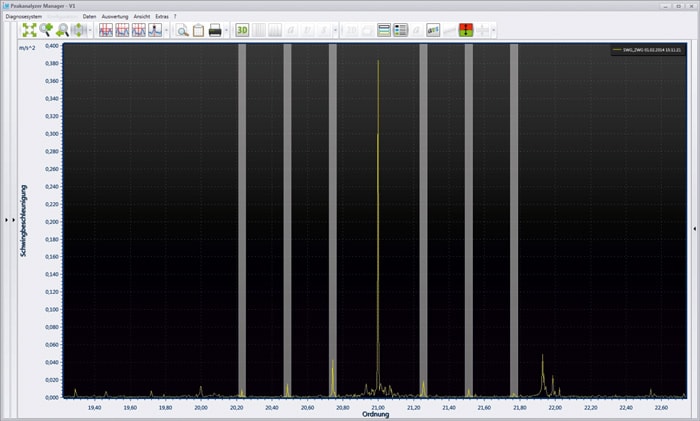
Phenomena, that could be described by vibrations, are visuable in the order spectrum. Orders are the multiples of a reference speed. Thus, speed variations do not affect the interpretation.
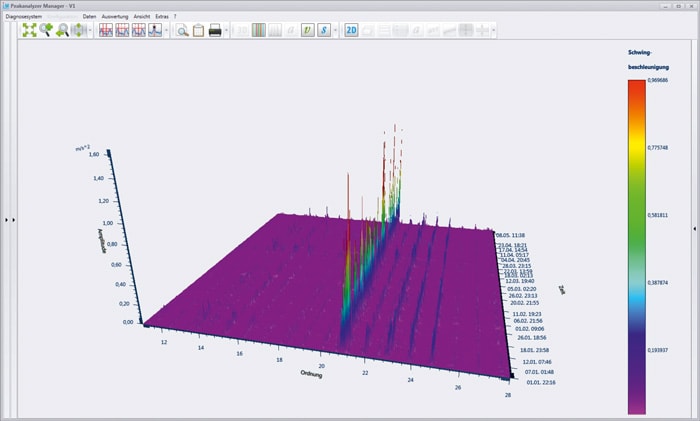
At the water flow chart, many spectra are arranged behind one another. So, it is possible, to detect changes of single spectral components, easily. The experienced viewer could quickly detect abnormal operating conditions. However, it is difficult to detect the absolute level of individual spectral components.
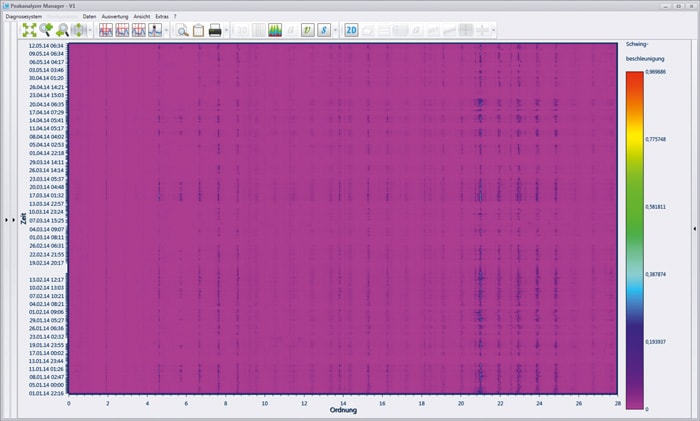
In the spectrogram, many spectra are arranged, one above the other. The result is a two-dimensional representation. The amplitude – the third dimension – is marked by different colours. So, the measuring of single values is quite simple.